Download Princeton/CMDL O2/N2 and CO2 data
Photos of the air O2/N2 and Ar/N2 analysis line
Photo of the Princeton air autosampler
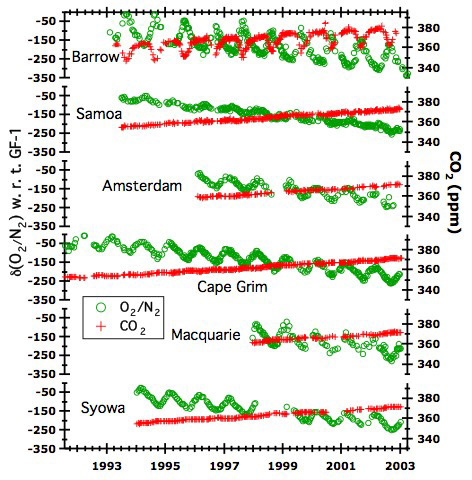
Studies of the O2/N2 ratios of air, begun in 1990 by R. F. Keeling and in 1991 by our lab, give information about the fate of fossil fuel CO2, the fertility of the oceans, ocean carbon fluxes in the context of the global ocean circulation, and interannual variability in all these terms. The figure below shows the annual cycle of the O2/N2 ratio of air, and the long-term decrease in O2/N2, as measured at Princeton. The caption describes first order features of the data, and the discussion following describes measurement meathods in use at Princeton and applications of the data to various problems. CO2 concentrations shown here were measured at the Climate Modeling and Diagnostics Laboratory, National Atmospheric and Oceanic Administration, Boulder, CO.
|
|
| O2/N2 and CO2 concentration of air, 1991-2003. O2/N2 data from our laboratory (units of per meg, defined below); CO2 data (units of ppm) from the Climate Modeling and Diagnostics Laboratory, NOAA, Boulder (collaboration with Drs. Pieter Tans and Thomas Conway). CO2 data (red show two well-known features: the anthropogenic increase, and the seasonal cycle, attributable mainly to the land biosphere. O2/N2 data show a long term decrease and a seasonal cycle. The long term decrease is due to O2 consumption during combustion, but its magnitude is smaller than consumption; the difference is due to net O2 production associated with net photosynthesis of the global land biosphere (and to a smaller extent, O2 degassing by the oceans linked to global warming). The seasonal cycle is the sum of the land and ocean biosphere contributions. The scales are such that one mole of O2 corresponds to the same displacement as 1 mole of CO2 (roughly the land stoichiometry). The excess amplitude in O2/N2 ratios is the contribution of the ocean biosphere. |
The O2 concentration of air, measured as the ratio of O2 to N2, varies seasonally and over longer timescales. The seasonal variation results from the activity of both the land biosphere and the ocean biosphere. On land, net photosynthesis in spring and summer produces O2 while it draws down CO2, raising the O2/N2 ratio. In winter, respiration consumes O2, and the O2/N2 falls. In the oceans, warming in spring and summer induces stratification, which promotes net production. Biological O2 supersaturates the water and induces a flux of O2 to the atmosphere. This flux adds to the continental input, both of which raise the atmospheric O2/N2 ratio during the growing season. Organic matter in the oceans sinks and consumes O2 in the ocean interior. In winter surface water cools, becomes denser, and mixes with O2 — depleted waters in the ocean interiors. These waters come to the surface and consume O2 to become resaturated. In each hemisphere, the O2/N2 ratio therefore rises in summer and falls in winter. Air mixes rapidly within each hemisphere, and O2/N2 changes represent fluxes of the biosphere over a very large scale. The contribution of the land biosphere to O2 changes is roughly equal and opposite to changes of CO2, allowing us to separate the contributions of land and oceans to the years O2/N2 cycle. Consequently, we can determine net oceanic production on the scale of a hemisphere or ocean basin by observing O2/N2 ratios at a few sites within each hemisphere. O2/N2 ratios provide our primary constraint on this rate and its interannual variability. When using the data in this way, one must consider the small influence of seasonal warming and cooling of the oceans on the O2/N2 ratio of air.
The annually averaged O2/N2 is also an important property. Combustion of fossil fuels consumes O2 at a well-known rate. Net growth of the land biosphere removes fossil CO2 and produces O2, attenuating the fossil decrease. Knowing the rate of fossil fuel combustion, the rate at which CO2 is rising, and the rate at which O2/N2 is decreasing, one can determine how anthropogenic CO2 emissions that do not accumulate in the atmosphere are distributed between the land biosphere and the ocean. Changes in the O2 inventory of seawater, due to anthropogenic and natural warming, may also have a significant influence on air O2 changes, and an appropriate correction is required.

|
| Table 4 from Bender et al. 2005 |
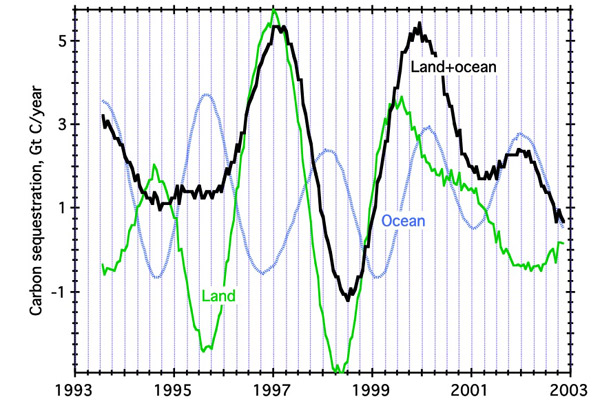
One can also use O2/N2 ratios to estimate the time dependence of land and ocean sequestration rates.
|
| Land, ocean, and total CO2 sequestration rates vs. time, 1993-2003, based on the O2 and CO2 balance, using data from Barrow, Samoa, and Cape Grim (Bender et al., 2005). From 1996-2001, land sequestration follows total sequestration closely, supporting independent conclusions that the land biosphere is responsible for most independent variability in CO2 uptake rates. |
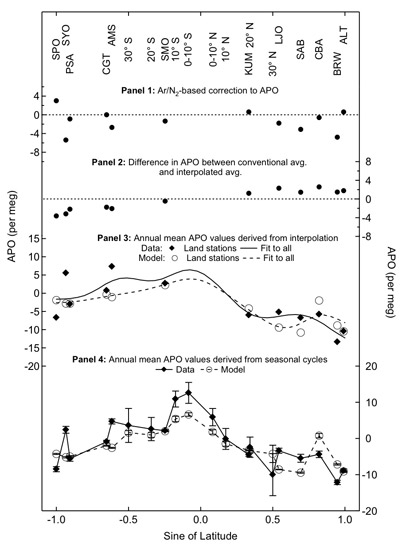
Accurate measurements of the meridional gradient in the O2/N2 ratio of air can answer two interesting questions about the carbon cycle, as first recognized by Ralph Keeling, Britt Stephens, and their colleagues. First, the meridional gradient reflects terms of the anthropogenic fluxes. Combustion consumes O2 in the northern hemisphere, where it is focused. Uptake of CO2 by the land biosphere produces O2; again, this process occurs mainly in the northern hemisphere, where most forests lie. Second, the global ocean circulation, combined with biological fluxes, should lead to the transfer of O2 from the oceans to the atmosphere at the equator. This transfer originates mainly in the upwelling of O2 - poor, nutrient - rich waters in the equatorial Pacific. When this water reaches the surface, it absorbs O2 from the atmosphere. However, it bears nutrients which lead to the production of organic carbon as wells as O2, which is then transferred to the atmosphere. It turns out that nutrients enable production of more O2 than is removed by the initial undersaturation. As a result, one expects there to be a maximum in the O2/N2 ratio at the equator.
|
APO (Apparent Potential Oxygen vs. sine of latitude at Princeton and Scripps sites. APO is the total of O2 and CO2 concentrations. It is expected to be a maximum at the equator, because upwelling in the equatorial Pacific brings nutrients to the surface that lead to net production and a flux of O2 to the atmosphere. Upwelling also brings CO2 rich waters to the surface that warm and degas CO2 to the atmosphere. Panels 3 and 4 compare observed annually averaged APO from data and models, with the data and models sampled in two different ways. The models are ocean biogeochemistry GCM's that predict the air-sea flux of O2 and CO2 in time and space. The atmopsheric GCM's transport these fluxes and predict values at observing stations. |
The challenge of measuring the O2/N2 ratio of air comes from the fact that the small changes of interest are superimposed on the large atmospheric background. O2/N2 variations are reported in units of per meg relative to an arbitrary standard:
δO2/N2 = [(O2/N2)sample/(O2/N2)reference -1]x 106, units of per meg
1 per meg = 0.001‰ using the standard stable isotope terminology. For reference, the amplitude of the annual cycle ranges up to about 80 per meg, and the annual decrease is about 20 per meg /yr. An error of 2.5 per meg in the rate of O2/N2 change translates to an uncertainty of ~ 1 Gt C/yr in the partitioning of CO2 sequestration. Ralph Keeling (Scripps Institution of Oceanography, University of California at San Diego) first developed a method for high precision O2/N2 analyses based on determining the refractive index of dry air (which reflects its composition). Our lab adopted many of Keeling's sample handing techniques and developed a measurement method based on isotope ratio mass spectrometry. Keeling, Stephens, Tohjima, and other workers have since developed and implemented high-precision measurements based on paramagnetic properties, UV absorption, H2 consumption, and gas chromatography.
Currently our lab is measuring O2/N2 in samples collected weekly or biweekly at 7 stations from Barrow, Alaska, to Syowa Station, on the Antarctic coast. Studies of atmospheric O2/N2 variations are underway at Scripps Institution of Oceanograpy, the National Institute for Environmental Studies (Tskuba, Japan), the University of Groningen, CSIRO (Australia), and Max Planck Institute for Biogeochemistry (Jena, Germany).