The Deep Structure of the Australian Continent
from Surface-Wave Tomography
Department of Earth, Atmospheric and Planetary Sciences
Massachusetts Institute of Technology (MIT)
Cambridge MA 02139, USA
Lithos, 48, 17-43, 1999.
Featured in:
Science 285 (5432), 1365-1366, 1999.
Abstract
We present a new model of three-dimensional
variations of shear wave speed in the Australian upper
mantle, obtained from the dispersion of fundamental and
higher-mode surface waves. We used Rayleigh wave data
from the portable arrays of the SKIPPY project
and from permanent stations (from AGSO,
IRIS and GEOSCOPE), amounting to about
1600 source-receiver combinations. AGSO data
have not been used before and provide better data
coverage of the Archean cratons in western Australia.
Compared to previous studies we also improved the
vertical parameterization and the weighting scheme that
accounts for variations in data quality and we reduced
the influence of epicenter mislocation on velocity
structure. The dense sampling by seismic waves provides
for unprecedented resolution of continental structure,
but the wave speed beneath westernmost Australia is not
well constrained owing to insufficient station
coverage. Global compilations of geological and
seismological data (using regionalizations based on
tectonic behavior or crustal age) suggest a correlation
between crustal age and the thickness and composition of
the continental lithosphere. However, the age and the
tectonic history of crustal elements vary on wavelengths
much smaller than have been resolved with global
seismological studies. Using our detailed regional upper
mantle model we investigate how the seismic signature of
tectonic units changes with increasing depth. At large
wavelengths, and to a depth of about 200 km, the
inferred velocity anomalies corroborate the global
pattern and display a progression of wave speed with
crustal age: slow wave propagation prevails beneath the
Paleozoic fold belts in eastern Australia and wave
speeds increase westward across the Proterozoic and
reach a maximum in the Archean cratons. The high wave
speeds that we associate with Precambrian shields extend
beyond the so-called Tasman Line, which marks the
eastern limit of Proterozoic outcrop. This suggests
that parts of the Paleozoic fold belts are underlain by
Proterozoic lithosphere. We also infer that the North
Australia craton extends off-shore into southwestern
Papua New Guinea and beneath the Indian Ocean. For
depths in excess of 200 km a regionalization with
smaller units reveals a more complex pattern. Some
tectonic subregions of Proterozoic age are marked by
pronounced velocity highs to depths exceeding 300 km,
but others do not and, surprisingly, the Archean units
do not seem to be marked by such a thick high wave speed
structure either. The Precambrian cratons that lack a
thick high wave speed ``keel'' are located near passive
margins, suggesting that convective processes associated
with continental break-up may have destroyed a once
present tectosphere. Our study suggests that deep
lithospheric structure can vary as much within domains
of similar crustal age as between units of different
ages, which hampers attempts to find a unifying
relationship between seismological units and crustal age
domains.
Figures
- Figure 01
Multiple scales of geological variability in Australia
- Figure 02
Locations of the
SKIPPY, IRIS, GEOSCOPE, and AGSO stations
- Figure 03
Body and surface-wave
phases: the use of group-velocity windows
- Figure 04
Sensitivity Fréchet kernels for surface wave propagation
- Figure 05
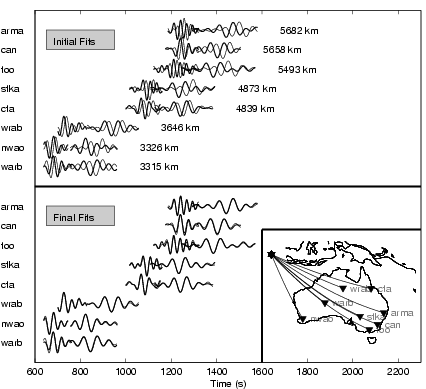
Waveform fitting by Partitioned
Waveform Inversion
- Figure 06
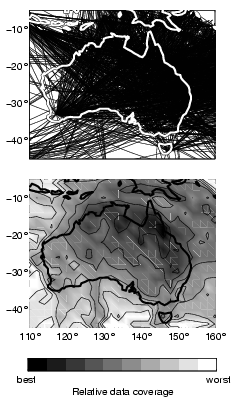
Path coverage of the
tomographic study
- Figure 07
Results of resolution
experiment in linear tomographic inversions
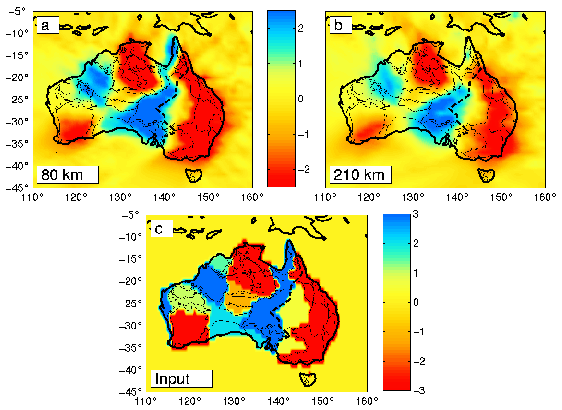
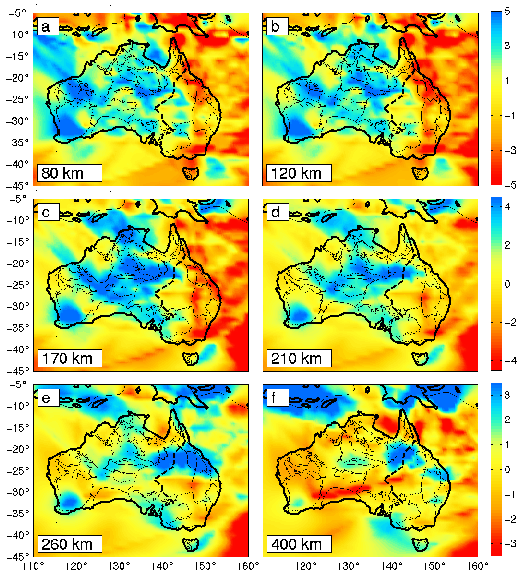
- Figure 08
Current surface wave speed
model: mapviews
- Figure 09
Current surface wave speed
model: profiles
- Figure 10
Local Earth models with
two-station method
- Figure 11
Comparison of present model
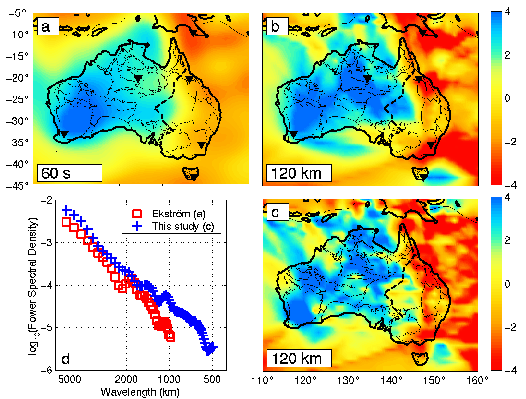
with global models: spatial and spectral
domains
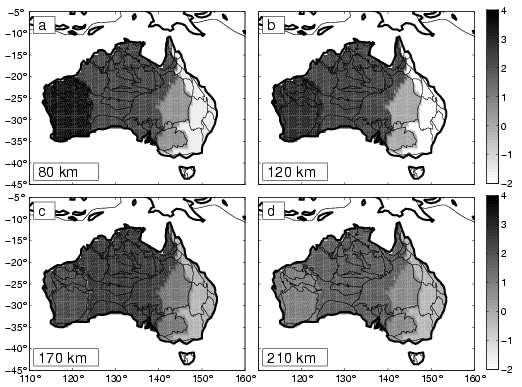
- Figure 12
Four-part regionalized
representation of the shear wave speed
- Figure 13
Age-dependent wave speed
variations with depth.
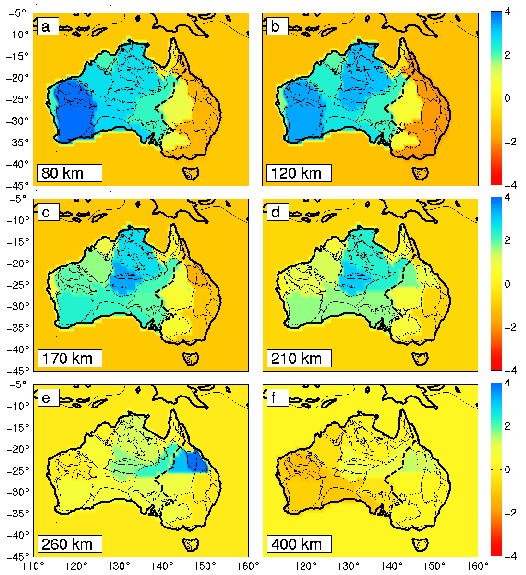
- Figure 14
Detailed regionalized
representation of the shear wave speed
- Figure 15
Definition and names
of the coarse regionalization (not included in
paper)
- Figure 16
Definition and names
of the fine regionalization (not included in
paper)
Frederik Simons
 Last modified: Wed Apr 12 23:06:25 EDT 2023
