Finding diurnal cycles in the temperature record at Hargraves Hall - 2
Contents
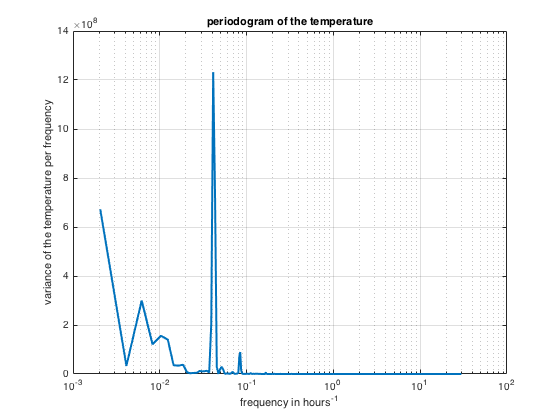
Read the data and make a simple plot
w=webread('http://geoweb.princeton.edu/people/simons/CSV/weather_data.csv');
temperature=w.x13_3;
dates=w.x1445486040/24/60/60+datenum(1970,1,1,0,0,0);
hours=[dates-datenum(dates(end))]*24;
nfft=length(time);
physl=hours(1);
[fax,selekt]=fftaxis1D(temperature,nfft,physl);
S=abs(fft(hanning(length(temperature)).*[temperature-mean(temperature)],nfft)).^2;
clf
semilogx(fax,S(selekt),'linew',2)
grid on
xlabel('frequency in hours^{-1}')
ylabel('variance of the temperature per frequency')
title('periodogram of the temperature')
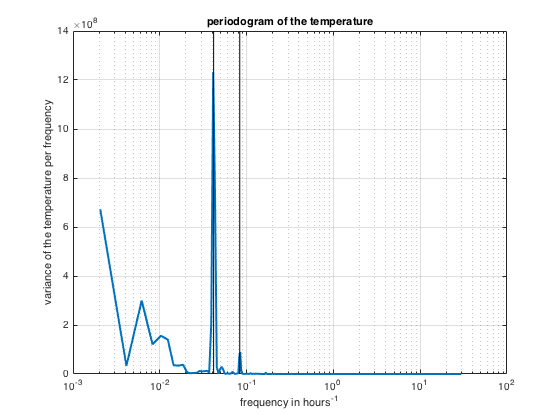
Now plot some reasonable periods on this graph
hold on
P=[24 12];
plot(1./[P(:) P(:)]',repmat(ylim,length(P),1)','k')
hold off
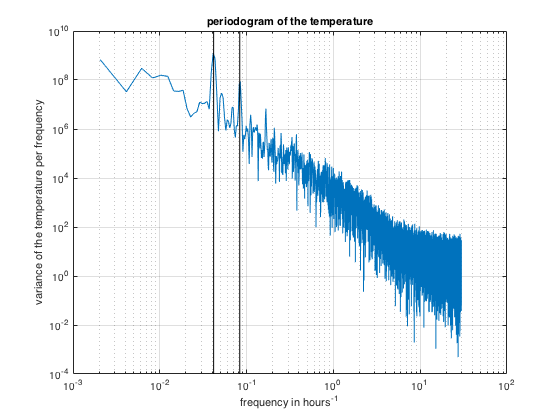
Experiment with the log-log plot
loglog(fax,S(selekt))
xlabel('frequency in hours^{-1}')
ylabel('variance of the temperature per frequency')
title('periodogram of the temperature')
grid on
hold on
P=[24 12];
plot(1./[P(:) P(:)]',repmat(ylim,length(P),1)','k')
hold off
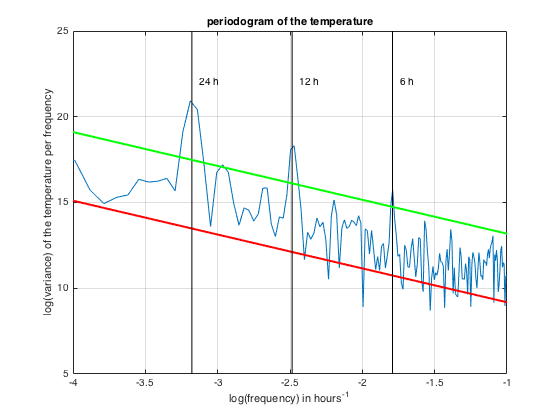
Fit a regression line to the log-log spectrum
regr=polyfit(log(fax(2:end)),log(S(selekt(2:end))),1);
slope=regr(1);
intrc=regr(2);
y=polyval([slope intrc],log(fax));
plot(log(fax),log(S(selekt)))
hold on
plot(log(fax),y,'r','linew',2)
xlim([log(fax(2)) log(fax(end))])
hold off
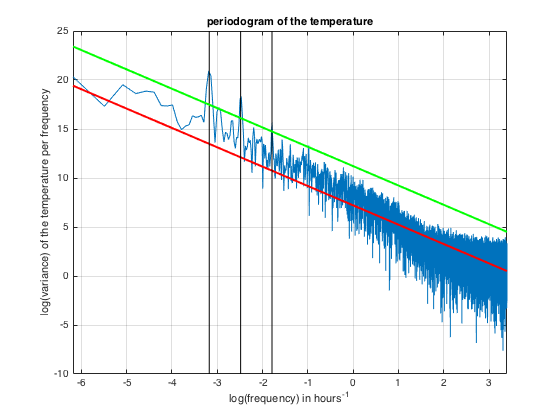
xlabel('log(frequency) in hours^{-1}')
ylabel('log(variance) of the temperature per frequency')
title('periodogram of the temperature')
grid on
hold on
P=[24 12 6];
plot(log(1./[P(:) P(:)]'),repmat(ylim,length(P),1)','k')
hold off
grid on

Move the regression line around by changing slope and intercept
offs=0.0;
offi=4.0;
yy=polyval([slope+offs intrc+offi],log(fax));
hold on
py=plot(log(fax),yy,'g','linew',2);
hold off
Zoom in on the interval of interest and add labels
xlim([-4 -1])
ylim([5 25])
for index=1:length(P)
    text(log(1/[P(index)])+0.05,22,sprintf('%i h',P(index)))
end